EUROSEISTEST
DATABASE
HOME
THE EUROSEISTEST
General
Facilities
Geology/Tectonics
Geotechnics/Geophysics
2D Structure
3D Structure
Links
Contact us
DATABASE SEARCH
Records
Events
Stations
References
SFSI
ANNOUNCEMENTS
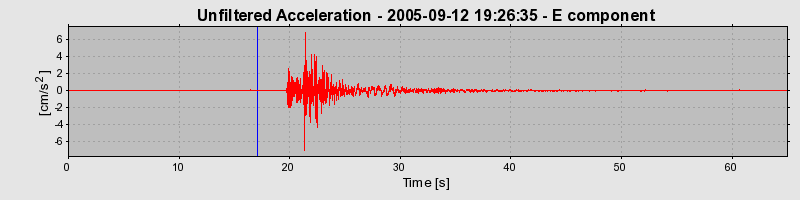
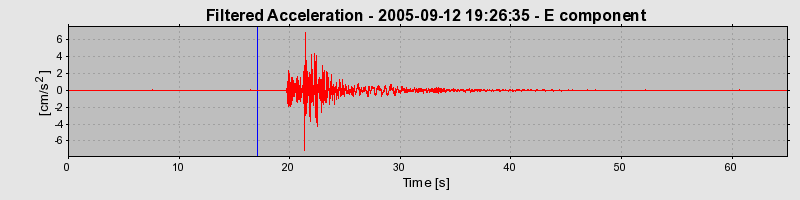
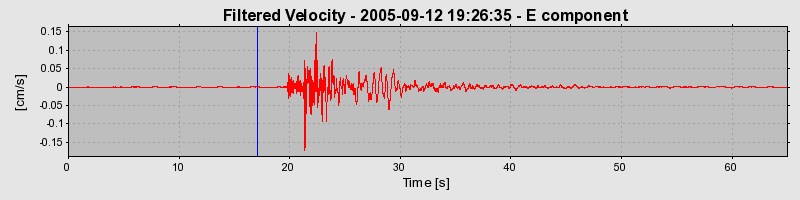
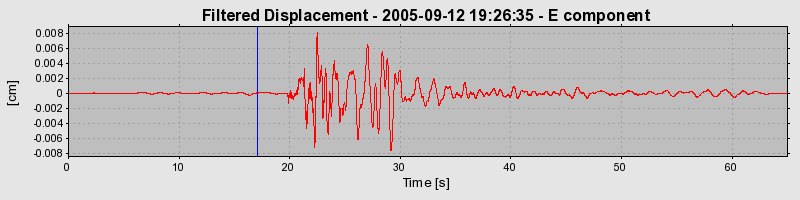
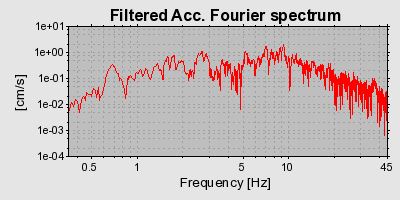
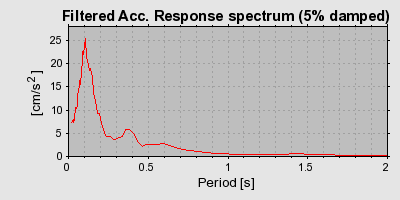
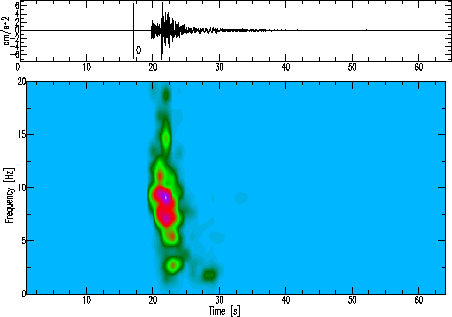
Waveform Plots - TST_136 - E component
Spectrogram of Filtered Acceleration